QUALITY FUNCTION DEPLOYMENT (QFD)
Introduction
Quality
Function Deployment (QFD) was developed to bring this personal interface to modern
manufacturing and business. In today's industrial society, where the growing
distance between producers and users is a concern, QFD links the needs of the
customer (end user) with design, development, engineering, manufacturing, and
service functions.
QFD is:
1.
Understanding Customer Requirements
2.
Quality Systems Thinking + Psychology +
Knowledge/Epistemology
3.
Maximizing Positive Quality That Adds
Value
4.
Comprehensive Quality System for
Customer Satisfaction
5.
Strategy to Stay Ahead of The Game
As a quality system that implements
elements of Systems Thinking with elements of Psychology and Epistemology
(knowledge), QFD provides a system of comprehensive development process for:
· Understanding 'true' customer needs from the customer's perspective
· What 'value' means to the customer, from the customer's perspective
· Understanding how customers or end users become interested, choose, and are satisfied
· Analyzing how do we know the needs of the customer
· Deciding what features to include
· Determining what level of performance to deliver
· Intelligently linking the needs of the customer with design, development, engineering, manufacturing, and service functions
· Intelligently linking Design for Six Sigma (DFSS) with the front end Voice of Customer analysis and the entire design system
Quality Function Deployment (QFD) is a
structured approach to defining customer needs or requirements and translating
them into specific plans to produce products to meet those needs. The "voice of the customer"
is the term to describe these stated and unstated customer needs or requirements.
The voice of the customer is captured in a variety of ways: direct discussion
or interviews, surveys, focus groups, customer specifications, observation,
warranty data, field reports, etc. This understanding of the customer needs is
then summarized in a product planning matrix or "house of quality".
These matrices are used to translate higher level "what's" or needs into
lower level "how's" - product requirements or technical
characteristics to satisfy these needs.
While the Quality Function Deployment
matrices are a good communication tool at each step in the process, the
matrices are the means and not the end. The real value is in the process of communicating
and decision-making with QFD. QFD is oriented toward involving a team of people
representing the various functional departments that have involvement in
product development: Marketing, Design Engineering, Quality Assurance,
Manufacturing/ Manufacturing Engineering, Test Engineering, Finance, Product
Support, etc.
The 'Voice of Customer'
Customer voices are diverse. In
consumer markets, there are a variety of different needs. Even within one
buying unit, there are multiple customer voices (e.g., children versus
parents). This applies to industrial and government markets as well. There are even
multiple customer voices within a single organization: the voice of the
procuring organization, the voice of the user, and the voice of the supporting
or maintenance organization.
These diverse voices must be
considered, reconciled and balanced to develop a truly successful product. One
technique to accomplish this is to use multiple columns for different priority
ratings associated with each customer voice in the product planning matrix.
Quality Function Deployment requires
that the basic customer needs are identified. Frequently, customers will try to
express their needs in terms of "how" the need can be satisfied and
not in terms of "what" the need is. This limits consideration of
development alternatives. Development and marketing personnel should ask
"why" until they truly understand what the root need is. Break down
general requirements into more specific requirements by probing what is needed.
Once customer needs are gathered, they then have to be organized.
The mass of interview notes, requirements documents, market research, and
customer data needs to be distilled into a handful of statements that express
key customer needs. Affinity diagramming is a useful tool to assist with this
effort. Brief statements which capture key customer requirements are
transcribed onto cards. A data dictionary which describes these statements of
need are prepared to avoid any misinterpretation. These cards are organized
into logical groupings or related needs. This will make it easier to identify
any redundancy and serves as a basis for organizing the customer needs for the
first QFD matrix.
QFD Methodoly Flow
Product Planning Using QFD
Once
customer needs are identified, preparation of the product planning matrix or
"house of quality" can begin. The sequence of preparing the product
planning matrix is as follows:
1.
Customer needs or requirements are stated on the left side of the matrix as
shown below.
These are
organized by category based on the affinity diagrams. Insure the customer needs
or requirements reflect the desired market segment(s). Address the unspoken needs
(assumed and excitement capabilities). If the number of needs or requirements exceeds
twenty to thirty items, decompose the matrix into smaller modules or subsystems
to reduce the number of requirements in a matrix. For each need or requirement,
state the customer priorities using a 1 to 5 rating. Use ranking techniques and
paired comparisons to develop priorities.
2.
Evaluate prior generation products against competitive products. Use surveys,
customer meetings or focus groups/clinics to obtain feedback. Include
competitor's customers to get a balanced perspective. Identify price points and
market segments for products under evaluation. Identify warranty, service,
reliability, and customer complaint problems to identify areas of improvement.
Based on this, develop a product strategy. Consider the current strengths and
weaknesses relative to the competition? How do these strengths and weaknesses
compare to the customer priorities? Where does the gap need to be closed and
how can this be done - copying the competition or using a new approach or technology?
Identify opportunities for breakthrough's to exceed competitor's capabilities, areas
for improvement to equal competitors’ capabilities, and areas where no improvement
will be made. This strategy is important to focus development efforts where they
will have the greatest payoff.
3.
Establish product requirements or technical characteristics to respond to
customer requirements and organize into related categories. Characteristics
should be meaningful, measurable, and global. Characteristics should be stated
in a way to avoid implying a particular technical solution so as not to constrain
designers.
4. Develop
relationships between customer requirements and product requirements or technical
characteristics. Use symbols for strong, medium and weak relationships. Be sparing
with the strong relationship symbol. Have all customer needs or requirement been
addressed? Are there product requirements or technical characteristics stated
that don't relate to customer needs?
5. Develop
a technical evaluation of prior generation products and competitive products. Get
access to competitive products to perform product or technical benchmarking. Perform
this evaluation based on the defined product requirements or technical characteristics.
Obtain other relevant data such as warranty or service repair occurrences and
costs and consider this data in the technical evaluation.
6. Develop
preliminary target values for product requirements or technical
characteristics.
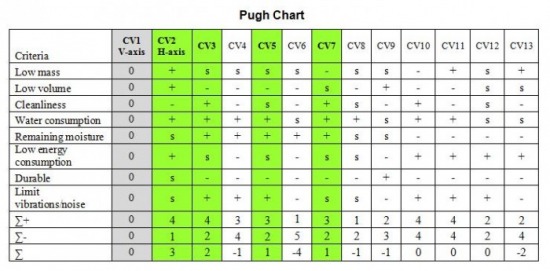
7.
Determine potential positive and negative interactions between product
requirements or technical characteristics using symbols for strong or medium,
positive or negative relationships. Too many positive interactions suggest
potential redundancy in "the critical few" product requirements or
technical characteristics. Focus on negative interactions - consider product
concepts or technology to overcome these potential tradeoff's or consider the
tradeoff's in establishing target values.
8.
Calculate importance ratings. Assign a weighting factor to relationship symbols
(9-3-1, 4-2-1, or 5-3-1). Multiply the customer importance rating by the
weighting factor in each box of the matrix and add the resulting products in
each column.
9. Develop
a difficulty rating (1 to 5 point scale, five being very difficult and risky)
for each product requirement or technical characteristic. Consider technology
maturity, personnel technical qualifications, business risk, manufacturing
capability, supplier/subcontractor capability, cost, and schedule. Avoid too
many difficult/high risk items as this will likely delay development and exceed
budgets. Assess whether the difficult items can be accomplished within the
project budget and schedule.
10.
Analyze the matrix and finalize the product development strategy and product
plans. Determine required actions and areas of focus. Finalize target values.
Are target values properly set to reflect appropriate trade off? Do target
values need to be adjusted considering the difficulty rating? Are they
realistic with respect to the price points, available technology, and the
difficulty rating? Are they reasonable with respect to the importance ratings?
Determine items for further QFD deployment. To maintain focus on "the
critical few", less significant items may be ignored with the subsequent
QFD matrices. Maintain the product planning matrix as customer requirements or
conditions change.
QFD Process
Quality Function Deployment begins with product planning; continues with product design and process design; and finishes with process control, quality control, testing, equipment maintenance, and training. As a result, this process requires multiple functional disciplines to adequately address this range of activities. QFD is synergistic with multi-function product development teams. It can provide a structured process for these teams to begin communicating, making decisions and planning the product. It is a useful methodology, along with product
development teams, to support a concurrent engineering or integrated product development approach .
Quality Function Deployment, by its very structure and planning approach, requires that more time be spent up-front in the development process making sure that the team determines, understands and agrees with what needs to be done before plunging into design activities. As a result, less time will be spent downstream because of differences of opinion over design issues or redesign because the product was not on target. It leads to consensus decisions, greater commitment to the development effort, better coordination, and reduced time over the course of
the development effort.
QFD requires discipline. It is not necessarily easy to get started with. The following is a list of recommendations to facilitate initially using QFD.
• Obtain management commitment to use QFD.
• Establish clear objectives and scope of QFD use. Avoid first using it on a large, complex project if possible. Will it be used for the overall product or applied to a subsystem, module, assembly or critical part? Will the complete QFD methodology be used or will only the product planning matrix be completed?
• Establish multi-functional team. Get an adequate time commitment from team members.
• Obtain QFD training with practical hands-on exercises to learn the methodology and use a facilitator to guide the initial efforts.
• Schedule regular meetings to maintain focus and avoid the crush of the development schedule overshadowing effective planning and decision-making.
• Avoid gathering perfect data. Many times significant customer insights and data exist within the organization, but they are in the form of hidden knowledge - not communicated to people with the need for this information. On the other hand, it may be necessary to spend additional time gathering the voice of the customer before beginning QFD. Avoid technical arrogance and the belief that company personnel know more than the customer.
Quality Function Deployment is an extremely useful methodology to facilitate communication, planning, and decision-making within a product development team. It is not a paperwork exercise or additional documentation that must be completed in order to proceed to the next development
milestone. It not only brings the new product closer to the intended target, but reduces development cycle time and cost in the process.