Pugh Analysis charts are similar to the pros vs. cons lists. These are used for evaluating multiple options against each other, in relation to a baseline option. The method was invented by Stuart Pugh, University of Strathclyde in Glasgow, Scotland as an approach for selecting concept alternatives.
Why is it important?
The time it takes a development team to analyze the scores and weighting factors is usually much shorter and cheaper compared to deploying the wrong solution to a project. Ranking the criteria further helps focus the team's efforts on the critical few.
When to use it?
Rather than simply listing the positive and negative aspects of each option, one by one, a matrix of the needs vs. concepts helps address multiple factors at the same time and gives the team a holistic view of the needs vs. alternatives at hand.
How to use it?
Step by step process:
- Develop a set of criteria based on customer's wants and needs.
- Enhance these criteria by including any item of functional nature.
- Develop a group of design concepts that are aimed at satisfying the criteria.
- Using a simple matrix - list criteria on the left and the concepts across the top. Use simple sketches to illustrate each of these concepts.
- Select one of the concepts as a baseline.
- Evaluate each concept against the datum for each of the criteria. Determine whether it is better (+), the same (0) or worse(-) than the baseline. Alternately, one could assign a -1, 0, +1 based on where each choice would stack up against a set of the agreed-to criteria. We could give each of these criterion a weight and get the composite score of the alternate*criterion to determine the better alternative.
- Record the team's decisions on the matrix.
- For each column, determine the total number of pluses, minuses and sames. Alternately, take the sum of the alternate score multiplied by weight of the criterion.
- Work to improve those concepts that scored best by incorporating strong ideas from other concepts.
- Continue the process of synthesizing concepts.
Hints
In the Pugh Analysis winners and losers will become visible at an early stage. The fact that one is forced to carry out a reflected evaluation of each parameter for each of the concepts is very important and is useful to prevent later surprises. Even though obvious losers (or winners) may be found at an early stage, the process requires a continuous elaboration to optimize the concepts.
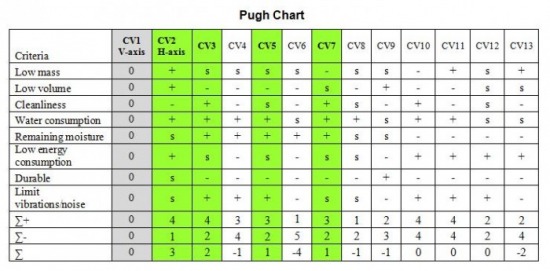
A Pugh matrix example
Let's say we're deciding between four alternatives, A, B, C, D. We already have a system in place and want to know if one of these four systems would be better for us.
We decide what our criteria are. We pick the four most important, the ones that absolutely must be included. Let's call them 1,2,3 and 4. (These can be price, time, ease of production, man-hours, whatever is most important. In companies, for example, they may get the customer/client involved here to ensure their satisfaction with the end result).
Let's draw our Pugh matrix. We put the alternatives across the top, and we are going to assess these with respect to the criteria, which we draw in on the left.
Our baseline is the system we have in place at the moment, so we score this a nought against our criteria. Our diagram will look like this.
Now consider option A. In relation to criteria 1, do we consider that it is better, the same as, or worse than the baseline? If it's better we give it a +1, if it's the same we give it a 0, and if it's worse we give it a -1. Let's say it's +1.
In terms of criteria 2, it's the same as the baseline. For criteria 3 it's better, and for criteria 4 its worse.
Our chart now looks like this.
We assess each of the alternatives B, C and D in the same way, filling in all the blanks.
So now we know the number of pluses, the number of minuses and the total score for each alternative, allowing us to make a more rational or objective decision. In this case it's obviously D, with three pluses and no minuses.
Weighting
We can also give each criterion a weighting. For example, if our first criteria is a 2, and the second criteria is twice as important we give that a four. The third criteria is somewhere in between, so it's a three. And the last criteria is probably the most important so that it gets a five. (It was funny writing that!!)
Our chart now looks like this.
Criteria 1 has a weighting of two. So all the numbers to the right of it are multiplied by two. Criteria four has a weighting of 5, so it's results are multiplied by five, etc.
Our Pugh matrix example now looks like this:
In our case the end result is the same, but depending on the number of criteria and the variables, the weighting you use can cause very different end results.
A further variation
Instead of the three-point scale we have used here, it it possible to use a five-point scale. For example:
+2 - much better than
+1 - better than
0 - equal to
-1 - worse than
-2 - much worse than
This can even be a 7 point scale, but anything finer may just complicate things unnecessarily.
+2 - much better than
+1 - better than
0 - equal to
-1 - worse than
-2 - much worse than
This can even be a 7 point scale, but anything finer may just complicate things unnecessarily.
Other Example

0 comments:
Post a Comment